COVID-19: A Look at Affiliate Performance in Turbulent Times
COVID-19: A Look at Affiliate Performance in Turbulent Times
Since the start of the pandemic, CJ has published the COVID-19 Network & Consumer Trends Report, an interactive view into consumer shopping trends and performance across four sectors and 20 categories. As each market around the globe has adapted and responded to the initial crisis, we hope this weekly report gave you a better understanding of the trends and consumer behaviors brought about by COVID-19. In this report, we share how the affiliate channel responded to market impacts from March to October 2020 as individuals and businesses moved from crisis response towards recovery.
In order to see how COVID-19 impacted 2020's peak ecommerce season, we recently launched our A Look Back at 2020’s Peak Shopping Performance.Dig into the Data & Insights
Stage One: Fear, Disbelief & Stocking Up
Learn moreStage Two: Acceptance & Settling In
Learn moreStage Three: Adapting to New Realities
Learn moreSummary: Rising to the Occasion
Learn moreA Look Back at the Data
Learn moreFear, Disbelief & Stocking up
March to Early April
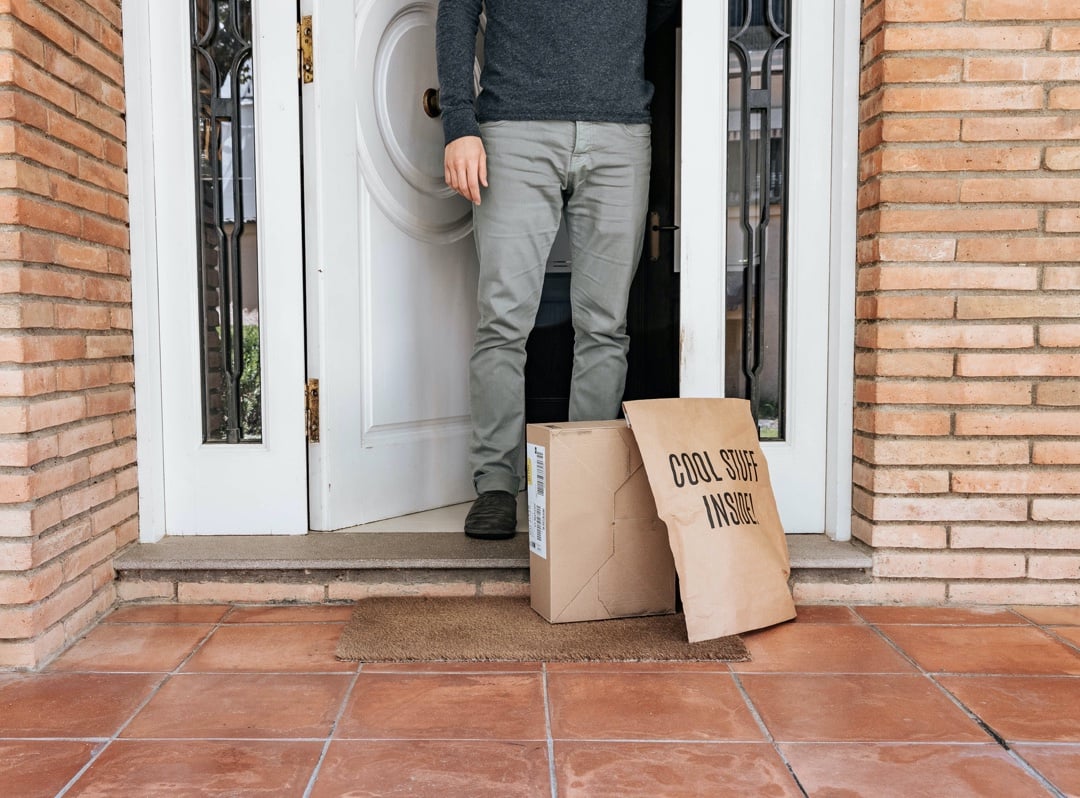
As brick and mortar stores closed, shoppers turned an eye towards replacing in-store shopping with digital shopping. Because this shift occurred quickly, consumers sought to understand and evaluate options that they may not have otherwise considered. Publisher sites quickly identified and adapted to consumer needs and shoppers turned to these resources for information and immediate, basic needs. These publishers also played a key role in educating consumers on inventory, supply, business shifts, and more to help brands quickly connect with shoppers who had not previously considered their brand. During this time period, the following occurred:
- Engagement with affiliate content and social publishers increased 40% YOY as individuals sought out information on the pandemic.
- Consumers rapidly purchased health and personal care items (vitamins, hand sanitizer, thermometers, toilet paper, etc.) from online retailers, due to avoiding in-store shopping.
- Inventory and delivery issues reached levels unfamiliar to many and would shape consumer choices and behaviors in the months ahead.
- Suspended travel caused bookings to plummet 82% YOY, while hotel and vacation booking brands dealt with cancellations.
- Finance brands pulled back consumer offers to mitigate risk due to high unemployment rates and economic uncertainty. Affiliate leads in the Finance sector decrease 10% YOY.
- The number of online shoppers grew as traditionally offline shoppers were driven to shop online due to the pandemic. According to eMarketer, nearly 150 million more people will be ecommerce buyers this year than last year.
Acceptance &
Settling In
Mid-April to Early June
As global communities endured lockdown measures, shoppers sourced options for new and recurring needs with affiliate sites being a valued third-party resource for identification of brands. Store closures, stocking, shipping, and fulfillment issues drove consumers to seek new online alternatives beyond Amazon and previously preferred brands. Here are examples of how consumer demand shifted during this stage:
- A mindset of cost-savings and hedging against the unknown spurred bargain hunting, which brands met with very deep discounts. Sales from coupon sites increased 20% YOY.
- In the US, the government-issued stimulus payments helped fund consumer spending. Affiliate sales for the mid April - early June time period increase 35% YOY.
- The US tax deadline was extended in light of record-high unemployment, drawing out and delaying seasonal filing peaks associated with tax.
- Across Europe, governments rolled out furlough programs which helped cushion income losses and maintained consumer spending, although more cautiously.
- The reality of the longevity of working from home and home-schooling fueled purchases of electronics, office décor, and educational items including monitors, headsets, webcams, desks, chairs, and online learning subscriptions.
- In Germany, governments lowered the Value-Added Tax to stimulate sales and affiliate sales increase 39% YOY.
- The Home & Business Services sector purchases, such as internet, mobile, web hosting and other productivity tools, increased 53% YOY as people prepared for the foreseeable future.
- In the US, travel ceased and consumers began seeking in-home entertainment options, while also embracing new hobbies and activities. This drove increased sales of athletic wear, art supplies, grocery items, kitchen tools, running shoes, and self-care products.
- Towards the end of April European governments gradually lifted the stay-at-home restrictions, and consumers optimistically began to plan for their summer holidays. By late June, travel bookings by European vacationers increase 50% compared to the prior month.
Adapting to New Realities
Mid-June to October
Regional variance in COVID-19 infection rates drove different responses in each market. Within the US, after Memorial Day many states began to see a renewed increase in COVID-19 cases leading to stricter closures while many locations within Europe and Asia began to see recovery. Across the world, consumer behavior remained largely digital with some in-store options gaining popularity as markets reopened. Examples of consumer shifts include:
- Curbside pick-up is the new way to receive goods locally from online retailers.
- As people remain close to home, athletic gear, health care items, and home electronics continue to garner a greater share of household spend. An interest in self-care drives Beauty sales up 50% YOY.
- For much of the world, travelling regionally/locally has replaced longer domestic and international trips with “staycations” increasing in popularity.
- Delays in school openings in many US regions resulted in a shift of purchases of children’s apparel and school supplies from mid-August to mid-September. Purchases of computers and electronics in late summer increase 83% YOY due to many schools adopting at-home school schedules.
- Historically low interest rates in the US market drove high demand in home refinancing, personal loans and more, even amidst stricter lending requirements.
- While most schools across Europe reopened by September, many retailers offered significant Back to School discounts creating competition for share of spend.
- Overall, a greater share of purchasing occurs and remains online now as consumers fully appreciate the convenience, cost and safety associated with online orders. Affiliate retail sales on average have increased 30% YOY.
Summary: Rising to the Occasion
The pandemic has exposed both strengths and risks, with companies who were able to quickly shift to meet digital demand fairing the best. The experience also created a ground shift in consumer shopping behavior—data from IBM’s Retail Index has indicated that the pandemic has accelerated the shift away from physical stores to digital shopping by roughly five years. This historical period in 2020 reconfirmed that the affiliate channel:
- Functions as a safe harbor for marketing investments with its cost-effective and risk-free pay-for-performance model.
- Remains adaptive and agile to shifting consumer demand, preference, supply and accessibility.
- Reaches unique audiences via authentic and trusted third parties.
- Offers consumers opportunities in nearly every online purchase category with varying incentives to buy.
- Supports regional differences by offering targeted reach to consumers in different states of need.
- Facilitates scalable, cost-effective growth through its reach to high-value shoppers.
A Look Back at
the Data
Network YOY by Day
Sector YOY
Sector YOY by Week
Top Categories YOY
For more information on these and other affiliate insights, contact your CJ Affiliate team or join our network today.
Most Recent COVID-19 Posts
How to Adjust Your Back to School Strategy for Inflation
Can you smell the bouquets of sharpened pencils? It’s Back to School time once again and parents and students are gearing up for a new year of ...
Spring Break, Here We Come! How Marketers Can Make the Most of Peak Travel Booking
Travel booking trends typically curve upward from January and peak in early August. However, a key booking period that often gets overlooked is from ...
Valentine's Day in the Time of Covid
Valentine’s Day in these wild, modern times is a very important shopping event for retailers. Read on for CJ’s take on what shoppers will be looking ...
Your New Best Friend: Reaching Gen Z in Australia, India, & Southeast Asia
From your resident Gen Z in India, here’s an all-you-need-to-know guide on how to win us over—the up-and-coming spenders! We’ll take a closer look at ...